|

|
WIND VELOCITY ON SUMMIT OF MOUNT WASHINGTON
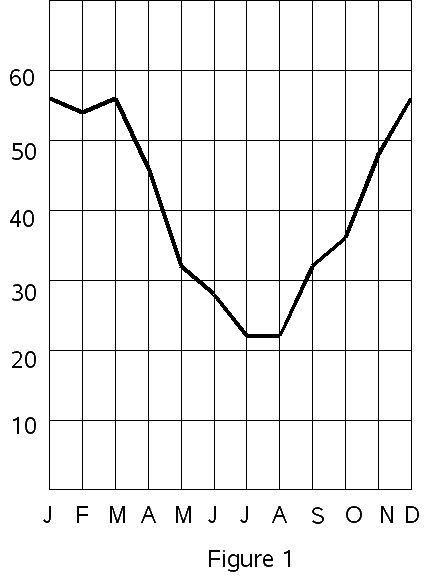
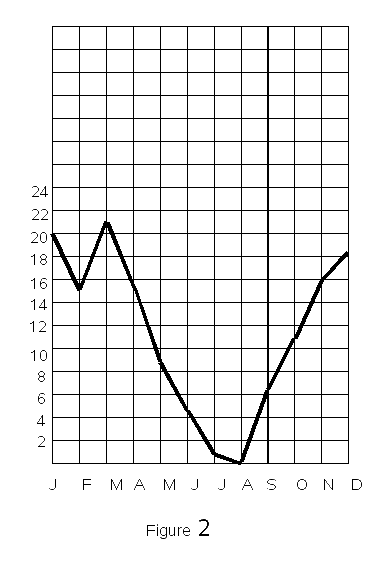
Figure 1 shows the average wind velocity each month in miles per hour. Figure 2 indicates the average number of days each month on which the wind reaches hurricane force.
The author, Charles Franklin Brooks, was, in Smith's words, "Professor of Meteorology at Harvard University, first Director of Harvard's Blue Hill Meteorological Observatory in Milton, Mass., and ... a principal founder and the first Secretary (1919-1954) of the A[merican] M[eteorological] S[ociety]", as well as "the leader in the establishment of the Mount Washington Observatory". (Read Smith's article [linked above] for a fuller story in which others, notably Joe Dodge, also get due credit for the Observatory.)
Everyone knows that the climate on Mount Washington is severe. People like comparisons, however, and many questions are asked. Is it worse than the climate on other high mountains in eastern United States? Is it worse than the climate on the higher peaks of the Pacific coast, or in Alaska? How does the climate of Mount Washington compare with that of the high mountains of Europe, with the worst parts of the Arctic, for example, Svalbard, or Spitzbergen, as we may again have to call it with Germany now in control of Norway? Adelie Land, in the Antarctic, is the "Home of the Blizzard." Is the climate on Mount Washington worse than it is there? I am afraid that even local pride will not make it possible for us to say that Mount Washington has the worst climate in in the world; but comparisons are of interest.
The severity of cold climate is described in terms of (1) the penetrating qualities of the wind, (2) the lowness of temperature, (3) the amount of snow, and (4) the occurrence of freezing fog. The first three are present, in varying degrees, in our familiar New England blizzards. All are found on Mount Washington.

|

|
The most extreme feature of the climate on Mount Washington is the velocity of the wind. Figure 1 shows the three-year average of the hourly wind velocity on the summit. This diagram, which shows average wind velocity of around 55 m.p.h. (miles per hour) from December to March, and more than 20 m.p.h. in the summer months, may not, at first blush, give the impression of the windiness which visitors to the summit have experienced. At lowland stations, however, the average wind velocities are generally in the neighborhood of 10 m.p.h., with higher values, up to 14 m.p.h. or more, only at exposed points on the coast, such as Cape Cod, Nantucket, and Cape Hatteras. Thus, the wind on Mount Washington averages something like four times the velocity of the lowland stations. This greater velocity, however, is not the measure of relative windiness. From a personal standpoint, we feel the wind as the pressure of the air upon us. The four times greater velocity on Mount Washington, allowing for the three-fourths density of the air at that level, gives Mount Washington a wind pressure of about twelve times that at the lowland stations.
As with any other meteorological element, it is not so much the average that counts, as the extreme conditions. Figure 2 shows the number of days per month on which the wind reached hurricane force (75 m.p.h.) in the years 1938 and 1939. From November to April a wind of this velocity occurred, on the average, at least every second day. In March, the windiest month, the wind reached hurricane force as often as two days out of every three. Winds of 100 or more m.p.h., which have an actual push nearly twice that of a 75 m.p.h. wind, have been recorded during the years 1932 to 1939, as follows:
| Wind Velocity (m.p.h.) | Hours Recorded |
|---|---|
| 100-109 | 385 |
| 110-119 | 208 |
| 120-129 | 79 |
| 130-139 | 23 |
| 140-149 | 6 |
| 150-159 | 7 |
| 160-169 | 0 |
| 170-179 | 1 |
The destructive effects of the hurricane winds on the forests in various ravines on the west and north side of Mount Washington, and the tremendous force brought against the Cog Railroad, the low trestle of which, though weighing 1100 pounds per running foot, was blown over by the wind,* indicate that the velocity of the wind in certain places, where it was concentrated by the topography of the mountain, may have appreciably exceeded the velocity on the summit.
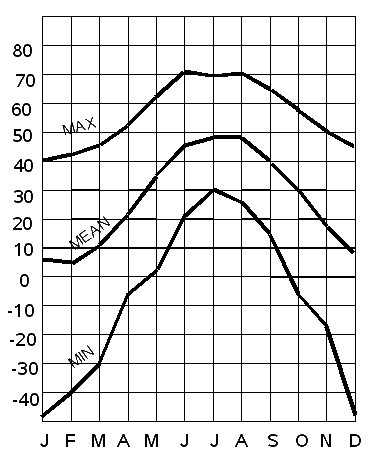
The low temperature on Mount Washington, the second of the four elements of a severely cold climate, is a marvel to visitors ascending the mountain at any time of the year. The average temperature on the summit is some 25 degrees lower than it is in the surrounding valleys. Occasionally, it is 40 or even 45 degrees colder. Figure 3 shows the mean monthly temperatures on Mount Washington, computed from the complete records of the United States Signal Corps and Weather Bureau,
-----
*See photograph in the June, 1939, issue of Appalachia, facing page 323.

High winds and low temperatures frequently attack together. Whereas in the lowlands the lowest temperatures occur in the calm after a cold wind has blown, the coldest periods on Mount Washington are brought by the strongest northerly winds of winter. On both occasions when the temperature was below 40° below, in the winter of 1933-1934, the wind reached velocities in excess of 100 m.p.h.
Snow, the third characteristic of a cold climate, occurs on Mount Washington in all months of the year. In the winter months it is the chief form of precipitation. The water content of the snow, however, averages only about a third of the total annual precipitation. The snowfall on the summit averages over 200 inches per year. This measured value is rather uncertain, because the snow that falls is usually quickly blown away, and other snow taht has fallen elsewhere is blown over the summit. The snow plume from Mount Washington may be seen for many miles. Much of the "snowfall" of Tuckerman Ravine and even Pinkham Notch, several miles away, is second-hand snow that has been blown off the mountain by the violent winds.
Freezing fog, the last in our list of considerations to detemine the severity of a cold climate, is one of the most remarkable
The cooling power of winds of such strength, at such low temperatures, and of the often accompanying snow and liquid droplets, might be observed with a katathermometer or frigorimeter (cooling rates of small, bare, warm bodies), but the figures would not be significant in a human sense because no one can go out in such conditions, at peril of freezing, without having complete wind-proof clothing and face protection. Almost as cold as the conditions under extremely low temperatures, are those when snow, and considerable wetness in consequence, accompany excessive winds at temperatures near the freezing point. In addition to the loss of heat from the body and clothing by radiation, conduction, and the blowing away of the heat by wind (the cooling power is about 100 millicalories per sq. centimeter per second at 32° F. and 100 m.p.h.), there is the loss of heat in raising any adhering snow to skin temperature and a greater loss in melting and evaporating it. As long as one's clothing stays dry, the rate of cooling is very much less than if it becomes wet. This is chiefly on account of the much greater conductivity of wet clothing and of wet skin. Thus, a wet condition at or near the freezing temperature may prove to have a
How do these climatic conditions compare with those on other mountains where observations have been made? In the eastern United States there is no mountain as high as Mount Washington until we reach North Carolina, where Mount Mitchell and some others reach a few hundred feet higher. The temperatures on Mount Mitchell are approximately 20 degrees higher and the winds there only about two thirds as strong. The snow and icing are correspondingly reduced. In eastern Canada, on the Gaspé Peninsula, there are fairly high mountains, and on the northern coast of Labrador the mountains rise to over 6,000 feet. We have no records and know of no reports of conditions on these mountains in winter. It is probable, however, that the Gaspé mountains, level for level, have as wet and windy a climate as Mount Washington, but not so cold, owing to the Gulf of St. Lawrence; and that the mountains in northern Labrador are on the whole less windy, less wet, and probably not much colder than Mount Washington, being fairly near Hudson Strait, from which direction winds colder than those which would reach Mount Washington would have to come.
The blizzards of the western plains have long had a deservedly bad reputation, though in more recent years, with the increased planting of trees, their sweep is not so deadly as it used to be. But Mount Washington need offer no apologies to the West. Sub-zero temperature, on our own major peak, with a wind of more than 100 m.p.h., air filled with blowing snow and freezing fog, can far outdo anything met on those open plains.
In the western United States, the Rocky Mountains reach much greater heights than Mount Washington. On Pike's Peak (14,110 feet), where the Signal Corps maintained an observatory for fifteen years, the temperature averaged 9° lower than Mount Washington, but the wind velocity was appreciably less, averaging some twenty to twenty-five per cent below that on Mount Washington. The extreme velocity on Pikes Peak, though something over 100 m.p.h., is appreciably less than the Mount
On the coastal mountains of the West we have no records from the Cascades region above the middle levels on the lee side of the Olympic Mountains and on the west side of Mount Rainier. It is probable that winds well above 100 m.p.h. occur on the summit, though not likely equal to the winds on Mount Washington, for the horizontal gradient of temperature in this region is less than in New England. The amount of moist air which passes over the Cascades, however, is much greater than that over Mount Washington, as may be readily noted in comparing winter photographs of the summits of western mountains, such as Mount Hood or Mount Rainier, with those of Mount Washington. The rime formations on these western mountains are tremendous, extending at times to twenty-five feet to windward.
An observatory was maintained for a few years on Mount Rose (10,800 feet) in the central Sierra Nevada. It was an un-attended observatory, in which the records were obtained by an automatic instrument with a long-continuing clock movement designed by S. P. Fergusson. In the period from 1905 to 1907 the lowest temperature was 8° F. below zero and the highest 71° F. above. The wind in winter appears to average only 20 m.p.h., and in summer less than 10. In severe storms, however, it exceeds 100 m.p.h. An estimate based on the pumping of the barometer shows an extreme maximum of approximately 130 m.p.h. The precipitation on the high Sierra, as is well known, is very great, much in excess of that on Washington.
There are many mountain stations in Europe. The most famous is Sonnblick Observatory in Austria, at a height of 10,170 feet, which now has a fifty-year record. The temperatures there, however, are much milder than Mount Washington's, ranging from a minimum of 8° Fr. in February to a maxi-
| |
|
| Photo by Trask's Studio Formed in a few moments while making an outside observation |
Photo by Zellon Summit of Mount Washington, winter of 1939-40 |
At the more norther stations the temperatures naturally are considerably lower, the winds stronger and the moisture features greater. The very worst we have record of is from Mount Nordenskiöld, Spitzbergen, in north latitude 78°, during the International Polar Year 1932-1933. This observatory was at a height of 3,480 feet above sea level. The maximum velocity of the wind was 132 m.p.h. for a whole hour. This would correspond to well over 150 m.p.h. for an extreme velocity. While this does not approach the Mount Washington record, it must be remembered that this mountain is only about half as high as Mount Washington, and that on the latter records have been kept for a longer period of years. Heavy riming was frequent, the anemometers having to be cleared of ice on one third to two thirds of the days in winter, which corresponds pretty closely to the situation on Mount Washington. The temperatures averaged 13° F. for the year, from a low monthly mean of 3° F. below zero to a high of 31° F. above. The lowest temperature for the year was 27° below zero. Here, even in this exposed Arctic mountain, we find neither wind nor temperature as severe as on Mount Washington, nor the icing any worse.
It is probable that there are worse mountains than Mount Washington, but observations do not seem to have been made upon them. Those of Kamchatka, of the Aleutian Islands, and, especially, the great mountains of Alaska, may at times have more severe conditions than Mount Washington, but I am inclined to doubt it, notwithstanding their high latitude and stormy locations, except for the mountains rising above 15,000 feet, where temperatures lower than on Mount Washington must occur and with winds well in excess of 100 m.p.h. The same must be true of the highest of the Himalayas, above 20,000 feet; though mountains at 9,000 and 11,000 feet in China have been found to experience surprisingly low wind velocities and moderate temperatures.
In Antarctica, Little America's worst has been a combination of 58° F. below zero with a wind of 43 m.p.h.; and in Adelie Land,
Thus it appears that while we cannot claim that Mount Washington is at times colder than anywhere else on earth, the severy of its climate at the worst seems to be equalled or slightly exceeded only on the very highest mountains of middle or high latitudes and in Antarctica's "Home of the Blizzard."